The financial condition of the Hudson Community School District deteriorated over the course of the 2010-2011 school year. This is due primarily to the fact that the district has been subject to declining enrollment at a time when cuts were made to the state aid portion of the foundation formula over a three years (including the fiscal year 2010-2011). In total, the district experienced a cut in state foundation aid of $574,295. In the fiscal year 2010-2011, state aid was underfunded by $222,435.
Additionally, the state failed to adequately fund the allowable growth formula, which contributed to a deterioration of the unspent budget authority and cash balances. At the close of the Fiscal Year, June 30, 2011 the unspent balance had deteriorated to $78,380, down from $210,606 the previous year. Unspent budget authority is one of the most important financial indicators in a school district.
The Board of Directors acted decisively in the spring of 2011, making significant and systematic budget cuts totaling over $574,000. While the financial condition of the school district is beginning to improve, it is important to stress that now is not the time to relax. As we continue to face declining enrollment and an allowable growth of zero percent for fiscal year 2013, we will need to carefully examine our spending habit, ensuring that we are maximizing all of our capital and human resources wisely.
 |
| Creditor's Equity Ratio |
The table and chart to the left is what is referred to as the Creditor's Equity Ratio. This tool is used to measure the amount of current assets that are provided by creditors. The amount of short term borrowing would be symptomatic of how dependent the school is on credit to cash flow business operations. Logic would suggest that as a school increases available cash to service operations, the less dependent on short-term debt it would become. Ideally, this ratio would be zero. There are two key takeaways from this ratio. First, the district currently participates in short term borrowing, typically during the month of September, which is prior to the first state aid payment of the school year and prior to the first of two large tax draws during the school year, and second; this ratio is on the decline which is good news for the school district. For Fiscal Year 2011, the district borrowed $350,000 in the month of September. In Fiscal Year 2012 (current) for the same month of September, the district borrowed $250,000.
The Day's Net Cash Ratio is typically calculated at the end of the fiscal period and give a good indication of how long a district can operate without the infusion of revenue. One of the limitations of this measure is that district expenditures are most generally made in large amounts on only a few days each month. At the same time, most schools receive revenue in large amounts on only a few times each month. The timing of these receipts is important to maintaining effective business operations. Inadequate cash on hand to service expenditure obligations requires the school to borrow funds creating added debt expense not directly tied to student instruction (see Creditor Equity Ratio above). The target range for this measure is between 90 and 120 days. In Iowa, it is especially important to note that state foundation aid to schools ends each fiscal year in mid June. The first payment of state aid for the new fiscal year does not begin again until September, a full 90 day gap. The key takeaway here is that the Day's Net Cash Ratio is not sufficient to sustain business operations longer than 46 days, which makes it necessary to participate in short term borrowing as is [also] indicated by the Creditor's Equity Ratio.
 |
| Day's Net Cash Ratio |
 |
| Financial Solvency Ratio |
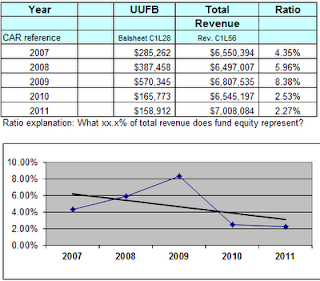
This is a measure of financial health that is considered one of the key indicators of financial health in a school district and measures the amount of undesignated, unreserved funds at the end of the fiscal period. In other words, if every financial obligation were met, how much capital would be available for other purposes? The target range for this tool is considered acceptable between 5% and 10%. Although this indicator has not declined as rapidly in the past few years, it is indicative of a weakened cash position. Notice the significant decrease from fiscal period 2009 to fiscal period 2010. This would represent the 10% across the board cut that was ordered by Governor Culver. You will also notice that in fiscal period 2011 there was not a rebound in cash position to offset the cut. This is because the cut was not restored and state aid continued to be underfunded in fiscal year 2011.
 |
| Investment Income Ratio |
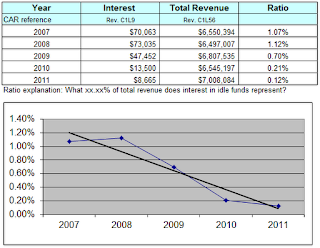
The Interest Income Ratio measures earnings of idle monies. This indicator can tell how aggressively the district's money has been managed and what contribution the investment income is making to total revenue. It is anticipated that this ratio should rise and fall in direct relationship with the Day's Net Cash Ratio. One reservation about using this ratio is that it is very susceptible to market fluctuations that are not within the control of district management. Stable to upward trends are most desirable for this trend, as you can see, our investment trend is in significant decline, which is indicative of a weakened economic condition that has been in place over a period of several years.
 |
| Student Transportation Ratio |
The Student Transportation Ratio measures the amount of the school budget spent on transportation costs. Examples would include operating and maintaining bus routes, driver costs, equipment purchases, and fuel. A high ratio may suggest to management that a disproportionate amount of resources are being spent in this area. Because the school district is only 57 square miles, this ratio carries a bit of good news for the school district. Compared to other school districts in Iowa, we have one of the smaller geographic districts. This enables the school district to better weather fluctuations in fuel prices that have embattled neighboring school districts in recent years.
The Unspent Balance Ratio measures the amount of cumulative district spending authority not spent at the end of each fiscal year. This ratio is unique to Iowa schools because they are funded according to state formula which is different than any other in the country. Because spending authority is vitally important to the financial health of any Iowa district, it must be included. I would argue that this is the most important indicator of financial health in school districts. The data for this indicator are provided by the Iowa Department of Management on the report titled "Unspent Budget Calculations". The unspent balance ratio has been is in serious decline, ending the fiscal year 2011 with an unspent balance of $78,380. It is important to note that it is a violation of Iowa Code to have a negative unspent balance. The only way to correct a declining unspent balance is to decrease expenses. The Board of Director's took decisive action in the spring of 2011 to make major budget cuts in an attempt to correct the declining unspent balance. While it is too early too make accurate predictions, it appears that the unspent balance has begun a correction. To put into perspective the seriousness of the unspent balance, Hudson current has an unspent balance of $78,360, compared to $1,500,000 in other school in the North Iowa Cedar League, which is our comparative group of like size schools.
If you have additional questions about the financial condition of the Hudson Community School District you are urged to contact me at avoss@hudson.k12.ia.us. The data used in this report has been collected and submitted to the Iowa Department of Education as part of the Certified Annual Report. These data were recently verified by the independent auditing firm of Burton E. Tracy & Co., P.C. The ratios selected for inclusion in this report were identified as being the most efficacious predictors of financial health for Iowa K-12 public schools as supported by formal quantitative research conducted in 2005 by Dr. Craig Hansel.

No comments:
Post a Comment