On Monday we had our first School Improvement Advisory Committee (SIAC) of the year. Indeed another sign the beginning of the school year is upon us! A primary topic of discussion for our SIAC during the August meeting is student achievement data and how our students performed on academic achievement goals. This data can be sliced and diced multiple ways, and the metrics that can be analyzed at times seem infinite. Yet as we have often discussed, the data does not provide a very accurate depiction of student learning in Iowa schools. We'll be talking more about student achievement in a future article or possible web post, but in an effort to whet your appetite here are a few interesting metrics from the Iowa Assessment our students took this past school year.
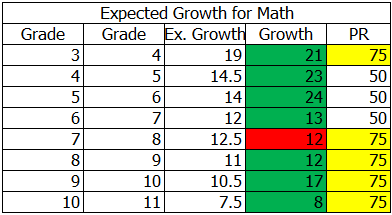
Each of these charts depict average (expected and met) growth of students from one grade level to the next. For example, in order for students to meet 'targeted growth' from 3rd grade to 4th grade in math, a growth of 19 points is expected. In our case, students grew 21 points so targeted growth was met. In the column at far right, you should notice a label titled PR, which stands for percentile rank. In most cases we should measure the growth factor based on the 50th percentile, which represents the average student. However, in many cases, Hudson students are anything but average! You should notice that some of these 'cells' are highlighted in yellow with a 75. This simply means that students in that particular grade level, on average, are above average!
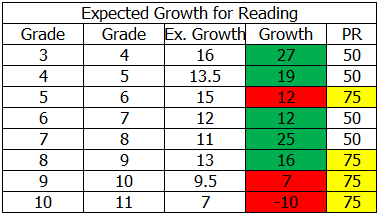
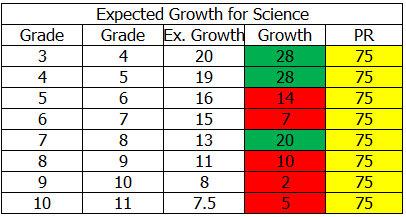 Now then, as the percentile rank increases, it becomes statistically more difficult for those students with a higher percentile rank to meet targeted growth. When analyzing this data set then, there are two important variables to consider. What is the expected targeted growth, and second, from which percentile rank are we measuring? The good news in this data set is that across the spectrum, in all cases save one, students have shown growth. (See 10th grade to 11th grade reading.) Those cells shaded in green are areas where grade levels exceeded targeted growth, whereas those shaded in red depict an area where students did not meet targeted growth. Yet there is still a silver lining here! In every case where targeted growth was missed, the average percentile rank is 75% or above. That may not seem like a lot, but statistically it is one standard deviation greater than the median!
That is a very brief snapshot of what the Iowa Assessment tells us about our student learning profile, and it barely scratches the surface in terms of data that is readily available! The trouble is, this data isn't really all that helpful. Even though I can create colored tables and charts galore that are quite impressive to look at, if the data isn't valid, who really cares?
Barring any changes from the legislature, this will be the last year we use the Iowa Assessment as our statewide test. This should be viewed as a good thing, because we have long known that what the Iowa Assessment measures isn't what is taught in Iowa schools. This mis-alignment has been known and studied extensively with research studies commissioned by several statewide organizations. The data, albeit statistically sound, does very little to tell us how our students are performing on the actual 'enacted' curriculum in our schools.
But change to the new Smarter Balance test has become a political football that has created some unusual bi-partisan alliances. Efforts to stop implementation of the Smarter Balance exam were fast and furious during the last legislative session. In the end a session delay was achieved, but efforts to scrap the exam and start all over ended up falling short with a veto by the governor. For that veto, we are thankful. Planning for the implementation of the new statewide assessment is moving forward, and undoubtedly will be a topic of intense negotiations and scrutiny once the legislators assemble in January.
My hypothesis is that the battle lines will be drawn around funding for this test. The cost of administration for Smarter Balance is significantly more than administration of the Iowa Assessment. I suppose one could argue that the least expensive test should be utilized because, after all, it makes sense to save money and use cost control measures wherever we can. But, why use a tool that doesn't answer the question that you are trying to answer? Wouldn't that be kind of like using a weed trimmer to mow the lawn? It works......sorta?
A possible resolution to this dilemma may come in the form of funding. What I fear could happen is the legislature allows the Smarter Balance test to go into effect, but fail to adequately fund it. Or worse yet, not fund it at all and mandate that it become (or replace) our current assessment protocol. This would make it an 'unfunded mandate'.
Schools are often asked to provide new programs, implement new laws, hire people for special jobs, or use a specific protocol to complete a task on a regular basis by decree of the legislature. The trouble with all these requests (or mandates), is it a rarity that funding is provided to achieve these goals. For these reasons the board opposes as one of it's legislative priorities "any new mandate that does not provide sufficient and sustainable funding for successful implementation."
It is my hope that Smarter Balance not only become the new statewide assessment, but that the legislator provides the necessary funds to ensure it's success.
No comments:
Post a Comment