Guest Blog Post by Instructional Coach Mike Lewis
In the Hudson district, the Clarity survey is taken annually by students, staff and parents. This survey measures the access to, proficiency with, and efficiency of technology in our schools. The wealth of information provided by this survey is immense, and impossible to summarize succinctly. Interested parties that would like to see all of the information may check out this link to see all the reports; I will attempt to give some highlights.
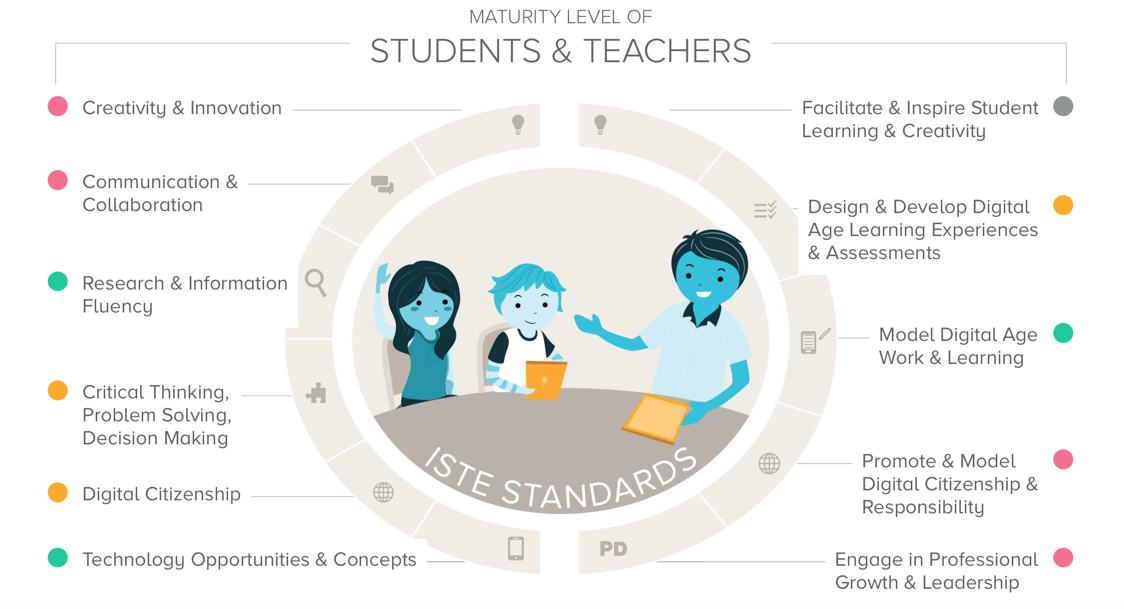
The International Society of Technology in Education (ISTE) has laid out eleven standards, six for students and five for teachers, to measure the integration of technology into learning. The infographic below shows how the Clarity survey measures our progress as a district in each of these standards. We are Proficient or Advanced in six of the eleven, Emerging in five and Beginning in one. The data collection from the previous year indicated Proficient or better in five, Emerging in four, and Beginning in two. We clearly have improved in the ISTE standards in the last year, though there is definitely still work to be done.
Our level of access to technology both in and out of school is outstanding, and has improved in the last year. 94% of our students have access to the Internet at home (up from 91%) last year, 91% have access to a device at home (up from 90%), and 68% share that device with others (down from 75%). This high degree of access outside the school allows students to interact with their learning in new ways that are not limited to the seven hours of the school day.
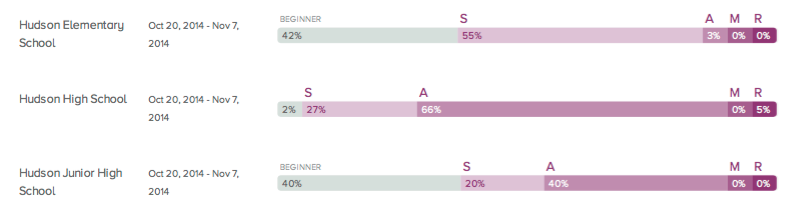
We understand that, while technology can transform the learning that takes place in our schools, it is not a process that will happen overnight. Teachers and students alike need to adjust their way they are used to doing things, and that change is happening in our district. To see the growth that is happening in the way technology is changing how our students and teachers interact with their learning, we can use the SAMR model. Briefly, SAMR indicates whether technology is being used to do the same things that we would do without tech, or if the tech is allowing students to do things that are literally impossible without it. Thinking of it as a spectrum, the “R” end indicates teaching that is truly transformative, and the “S” end indicates activity that doesn’t really do anything different than could be done without the tech.
November 2014
November 2015

These graphs indicate the progress that is being made, and the work that lies ahead. Note that the elementary is essentially unchanged - not surprising, since the access to technology at the elementary level is much more limited. The high school is largely unchanged as well, but note how the junior high has moved considerably to the “R” end of the spectrum. As teachers geared up for the increased access that the junior high students would have starting in Jan 2016, their instruction began to transform accordingly.
It should be stated that the goal is not to get 100% of instruction to the “R” end of the SAMR spectrum. Students still do - and will continue to - develop skills with writing, pencil-and-paper computations, hands-on activities that do not require technology. But as we understand that technology drives our world in greater ways every day, integrating that technology into our instruction is only that much more important.
No comments:
Post a Comment